- Ably FAQs
- Troubleshooting
- Development tools
-
Account billing and packages
-
General
-
Realtime API and client libraries
-
Troubleshooting
-
Channels
-
REST API and client libraries
-
Ably error codes
-
Account and app setup and configuration
-
Ably architecture, transports, and security
-
Performance and Redundancy
-
Push Notifications
-
Integrations
-
Migrating to Ably from an existing service
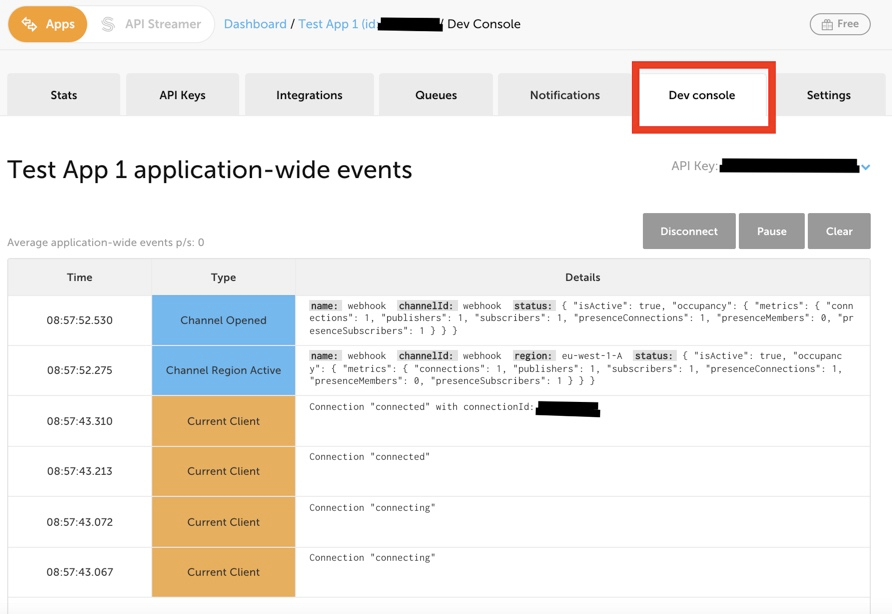
Do you have a debugging or development console for testing?
Yes we do. For each app, you can monitor connection and channel events, and can additionally perform most high level operations from the dev console in your app dashboard. Visit your app dashboard and click on the "Dev console" tab. A screenshot of the dev console can be seen below.
If you would like to debug Reactor message queues, please see queue debugging tips.
Reach out on our support portal if you have any further questions and we will be happy to help.